HostSailor is an experienced hosting company based in UAE that provides virtual private servers (VPS), dedicated servers, domains, SSL (TLS) certificates and other related addons. Their plan pricing is really good. When I was given the opportunity to try out their OpenVZ VPSes, I couldn’t say no.
Before I begin with the review, lets have a brief introduction about them and the plans they offer.
Datacenters
HostSailor has their datacenters in Netherlands and Romania. The Netherlands facility has 700 Gbps+ and the Romanian one has 1TB+ of internet capacity, collected from several peering and transit providers. Each of the physical servers in these datacenters use a 2×10 Gbps bonded pair to a switch. The Netherlands facility uses Cisco core switches while the Romanian one uses Juniper. You can read more about their datacenters here.
Plans and pricing
Their OpenVZ VPS have two options, HDD-based and SSD-based.
The HDD-based VPS have the following plans:
- Mini Sailor – $1.99/mo – 256 MB RAM, 256 MB swap – 15 GB storage – 1 core – 256 GB data transfer
- Sailor – $2.99/mo – 512 MB RAM, 512 MB swap – 25 GB storage – 1 core – 512 GB transfer
- Seaman – $4.99/mo – 1 GB RAM, 1 GB swap – 45 GB storage – 2 core – 1 TB data transfer
- Lieutenant – $9.99/mo – 2 GB RAM, 2 GB swap – 75 GB storage – 3 core – 2 TB transfer
- Captain – $19.99/mo – 4 GB RAM, 4 GB swap – 120 GB storage – 4 core – 4 TB transfer
- Commodore – $38.99/mo – 8 GB RAM, 8 GB swap – 180 GB storage – 4 core – 8 TB transfer
The SSD-based VPS have the following plans:
- Mini Sailor – $2.99/mo – 256 MB RAM, 256 MB swap – 10 GB storage – 1 core – 256 GB data transfer
- Sailor – $4.99/mo – 512 MB RAM, 512 MB swap – 15 GB storage – 1 core – 512 GB transfer
- Seaman – $7.99/mo – 1 GB RAM, 1 GB swap – 20 GB storage – 2 core – 1 TB data transfer
- Lieutenant – $15.99/mo – 2 GB RAM, 2 GB swap – 40 GB storage – 3 core – 2 TB transfer
- Captain – $29.99/mo – 4 GB RAM, 4 GB swap – 60 GB storage – 4 core – 4 TB transfer
- Commodore – $56.99/mo – 8 GB RAM, 8 GB swap – 80 GB storage – 4 core – 8 TB transfer
Each of the plans offer 1-2 IPv4 address. A block of /64 IPv6 address are available on request.
You can read more about the OpenVZ plans here.
HostSailor also offers Xen and KVM VPS hosting, the details of you can find by clicking this link. Also, dedicated servers are available.
The VPS plan reviewed
I got the opportunity to review two of their VPS products, namely the HDD- and SSD-based Sailor plans. The two plans are similar with 512 MB RAM, 1 core and 512 GB data transfer. The HDD one is cheaper ($2.99/mo) than the SSD one ($4.99/mo) and has more storage (25 GB vs 15 GB). However, the SSD plan’s I/O is definitely going to be serveral magnitudes faster than the HDD plan.
So, how much does HostSailor live up to its promise? Lets find out.
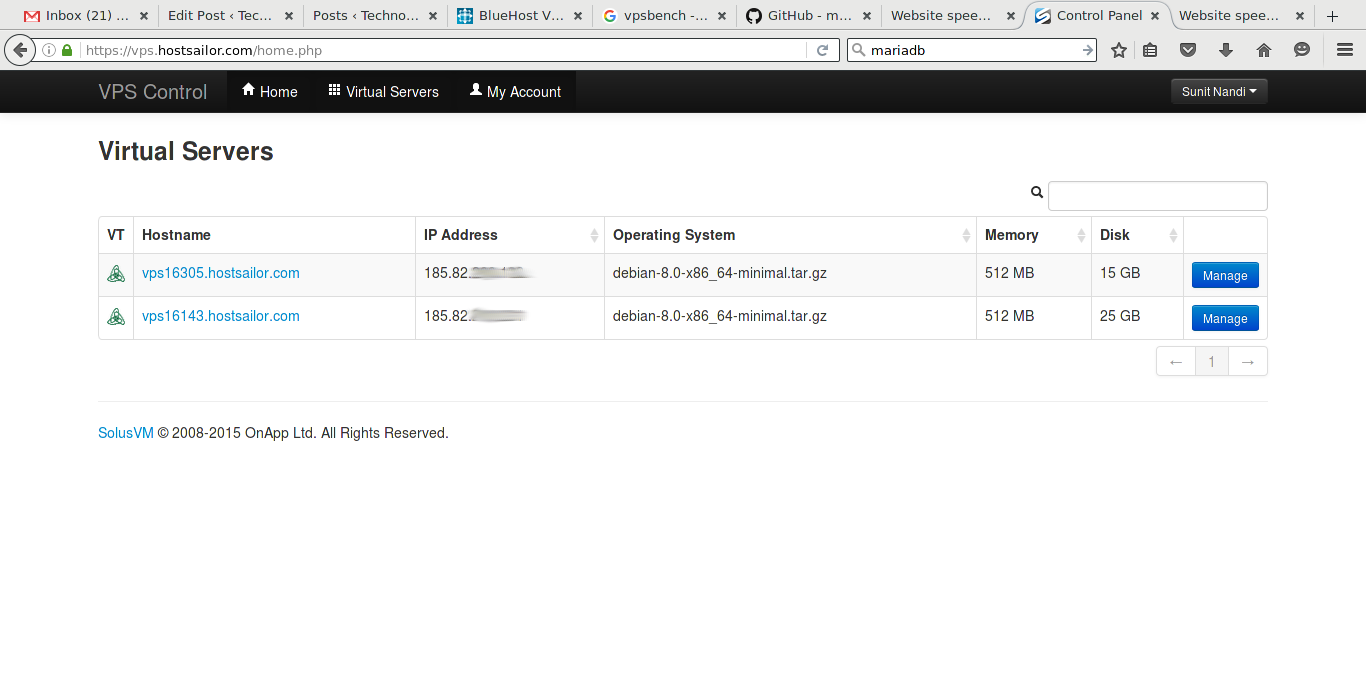
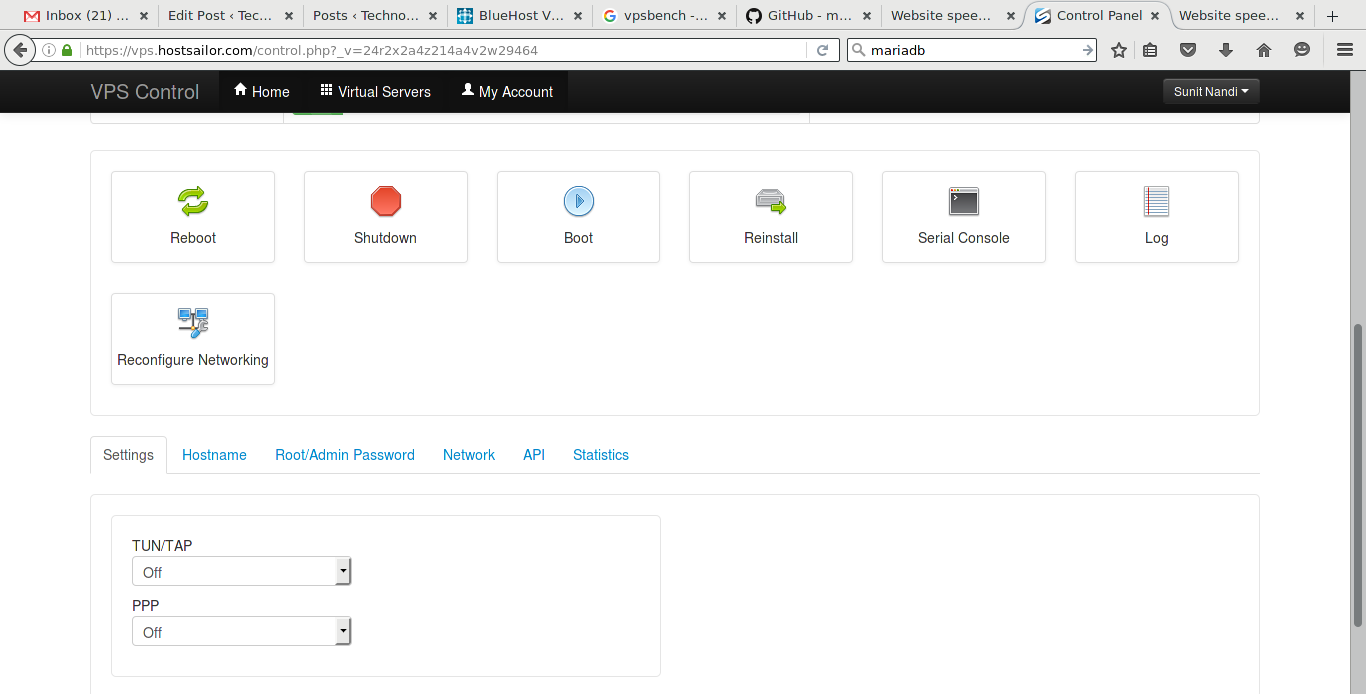
Control panel
HostSailor uses SolusVM which is available on most VPS hosts. To those familiar to VPSes, there is nothing much to talk about here. SolusVM lets you power off, start, reboot, reinstall, change root password, configure networking, etc. of the VPSes. The SolusVM here at HostSailor doesn’t display IPv6 addresses by default as they have to be manually assigned by contacting the support team.
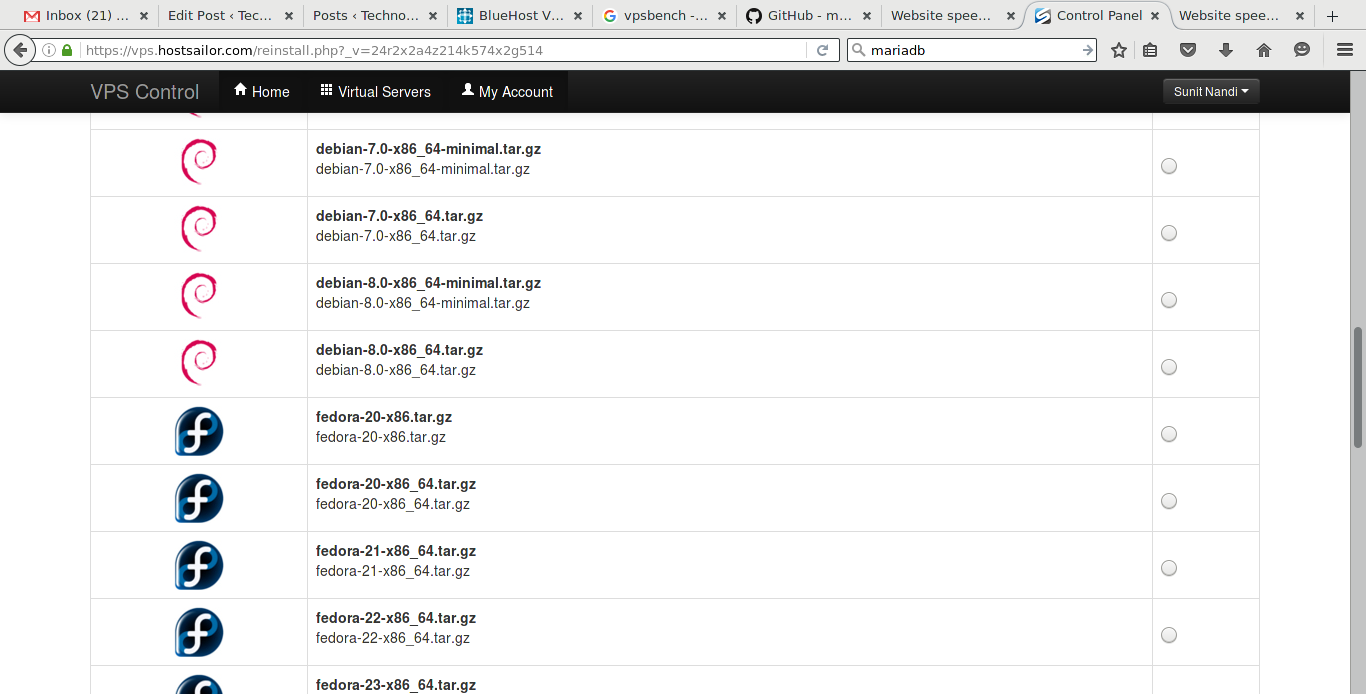
The OS images available at HostSailor are mostly stock OS images, without much editing or customization. This means, you get pretty much the pure OS you intend to install, without the service providers’ additional options and software repositories.
System information
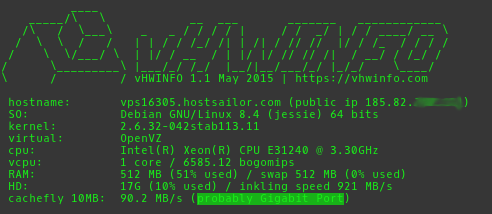
I used the VHWInfo script to obtain basic information about the VPSes including hostname, OS, kernel, virtualization, CPU type and speed, etc.
For the HDD VPS:
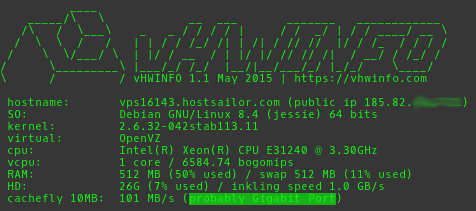
For the SSD VPS:
Network speed test
Most people use their VPS to host online content, whether it is websites, chatrooms, radio stations, sync servers. Only a small percentage use it for computationally heavy tasks. So the first and foremost we shall begin with the network tests.
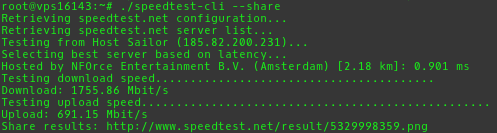
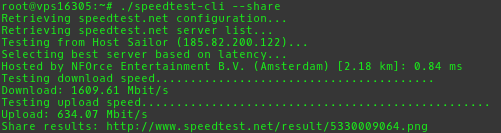
I downloaded speedtest-cli and tested the two VPS.
Speedtest of the HDD VPS:

Speedtest of the SSD VPS:

Also I ran the vpsbench script and noticed the section which benches the network throughput.
For the HDD VPS:
Downloading from CacheFly ... 104MB/s
Downloading from Linode - London UK ... 93.9MB/s
Downloading from Leaseweb - Haarlem NL ... 106MB/s
Downloading from Softlayer - Singapore ... 12.0MB/s
Downloading from Softlayer - Seattle WA ... 15.2MB/s
Downloading from Softlayer - San Jose CA ... 14.5MB/s
Downloading from Softlayer - Washington DC ... 26.8MB/s
For the SSD VPS:
Downloading from CacheFly ... 107MB/s
Downloading from Linode - London UK ... 67.5MB/s
Downloading from Leaseweb - Haarlem NL ... 98.5MB/s
Downloading from Softlayer - Singapore ... 8.11MB/s
Downloading from Softlayer - Seattle WA ... 15.6MB/s
Downloading from Softlayer - San Jose CA ... 14.9MB/s
Downloading from Softlayer - Washington DC ... 26.1MB/s
Both the VPSes have similar network connectivity and top-notch performance. The throughput to Europe and North America is superb and that to Asia-Pacific is pretty good. The bandwidth to a CDN provider like CacheFly is more than awesome, meaning that any CDN will be a synergistic combination with a HostSailor VPS.
I’ll highly recommend both these VPS for anyone running applications which are heavily network dependent.
I/O test
The next thing I’m going to test is I/O. This matters to people who perform a lot of small read-writes on their disks, especially for maintaining web sessions and logging. Its also a well-known fact that good I/O speeds improve database (especially RDBMS) performance by a huge extent. It is a reason why SSDs are recommended for MySQL and PostgreSQL users.
Remember the vpsbench script I used in the last section? It benches the I/O as well.
Here’s the snippet of the output for HDD VPS:
I/O speed: 379 MB/s
Here is the output for the SSD VPS:
I/O speed: 992 MB/s
379 MB/s looks pretty good for rotational media and clearly matches the performance of many desktop SSDs. The SSD VPS however blows everything out of the water at 992 MB/s as it is one of the highest throughputs SSDs can offer. It is actually even faster than the BlueHost VPS that we reviewed two year back, and is close or better than most “cloud” based SSD VPS offerings like DigitalOcean and Linode. At $4.99/month, the SSD VPS looks like a really good deal for database-based applications.
However, raw disk throughput has little significance in real life scenarios. What matters mostly is IOPS and disk response time, if you expect your application to be responsive. We use ioping to test that.
For the HDD VPS, the disk latency test:
root@vps16143:~/ioping# ./ioping . -c 10
4 KiB from . (ext4 /dev/ploop53344p1): request=1 time=8.15 ms
4 KiB from . (ext4 /dev/ploop53344p1): request=2 time=67.3 ms
4 KiB from . (ext4 /dev/ploop53344p1): request=3 time=11.7 ms
4 KiB from . (ext4 /dev/ploop53344p1): request=4 time=17.8 ms
4 KiB from . (ext4 /dev/ploop53344p1): request=5 time=16.4 ms
4 KiB from . (ext4 /dev/ploop53344p1): request=6 time=9.76 ms
4 KiB from . (ext4 /dev/ploop53344p1): request=7 time=15.0 ms
4 KiB from . (ext4 /dev/ploop53344p1): request=8 time=19.3 ms
4 KiB from . (ext4 /dev/ploop53344p1): request=9 time=14.2 ms
4 KiB from . (ext4 /dev/ploop53344p1): request=10 time=16.7 ms

--- . (ext4 /dev/ploop53344p1) ioping statistics ---
10 requests completed in 196.2 ms, 40 KiB read, 50 iops, 203.9 KiB/s
min/avg/max/mdev = 8.15 ms / 19.6 ms / 67.3 ms / 16.2 ms
The disk seek rate (IOPS):
root@vps16143:~/ioping# ./ioping -RD .

--- . (ext4 /dev/ploop53344p1) ioping statistics ---
124 requests completed in 3.01 s, 496 KiB read, 41 iops, 165.0 KiB/s
min/avg/max/mdev = 149.0 us / 24.2 ms / 145.0 ms / 29.3 ms
The disk sequential speed:
root@vps16143:~/ioping# ./ioping -RL .

--- . (ext4 /dev/ploop53344p1) ioping statistics ---
531 requests completed in 3.02 s, 132.8 MiB read, 175 iops, 44.0 MiB/s
min/avg/max/mdev = 651.0 us / 5.69 ms / 187.1 ms / 17.4 ms
The disk cached I/O speed:
root@vps16143:~/ioping# ./ioping -RC .

--- . (ext4 /dev/ploop53344p1) ioping statistics ---
2.94 M requests completed in 2.55 s, 11.2 GiB read, 1.16 M iops, 4.41 GiB/s
min/avg/max/mdev = 448 ns / 865 ns / 147.4 us / 509 ns
The HDD VPS is a slacker when it comes to I/O and it clearly reflects the issues in rotational media. The seek speed in random access is really time consuming (in the millisecond range). However, in both sequential and cached read access, it performs pretty well.
For the SSD VPS, the disk latency test:
root@vps16305:~/ioping# ./ioping . -c 10
4 KiB from . (ext4 /dev/ploop48585p1): request=1 time=77.7 us
4 KiB from . (ext4 /dev/ploop48585p1): request=2 time=134.1 us
4 KiB from . (ext4 /dev/ploop48585p1): request=3 time=168.4 us
4 KiB from . (ext4 /dev/ploop48585p1): request=4 time=120.4 us
4 KiB from . (ext4 /dev/ploop48585p1): request=5 time=121.2 us
4 KiB from . (ext4 /dev/ploop48585p1): request=6 time=125.0 us
4 KiB from . (ext4 /dev/ploop48585p1): request=7 time=113.3 us
4 KiB from . (ext4 /dev/ploop48585p1): request=8 time=110.0 us
4 KiB from . (ext4 /dev/ploop48585p1): request=9 time=111.7 us
4 KiB from . (ext4 /dev/ploop48585p1): request=10 time=115.2 us

--- . (ext4 /dev/ploop48585p1) ioping statistics ---
10 requests completed in 1.20 ms, 40 KiB read, 8.35 k iops, 32.6 MiB/s
min/avg/max/mdev = 77.7 us / 119.7 us / 168.4 us / 21.4 us
The disk seek rate (IOPS):
root@vps16305:~/ioping# ./ioping -RD .

--- . (ext4 /dev/ploop48585p1) ioping statistics ---
14.8 k requests completed in 2.96 s, 57.9 MiB read, 5.00 k iops, 19.5 MiB/s
min/avg/max/mdev = 39.5 us / 200.0 us / 9.32 ms / 153.7 us
The disk sequential speed:
root@vps16305:~/ioping# ./ioping -RL .

--- . (ext4 /dev/ploop48585p1) ioping statistics ---
4.83 k requests completed in 2.89 s, 1.18 GiB read, 1.67 k iops, 418.4 MiB/s
min/avg/max/mdev = 230.6 us / 597.5 us / 6.15 ms / 289.2 us
The disk cached I/O speed:
root@vps16305:~/ioping# ./ioping -RC .

--- . (ext4 /dev/ploop48585p1) ioping statistics ---
2.88 M requests completed in 2.53 s, 11.0 GiB read, 1.14 M iops, 4.34 GiB/s
min/avg/max/mdev = 448 ns / 879 ns / 1.99 ms / 1.55 us
The SSD VPS is completely opposite and has more than superb disk response time (in the range of microseconds). The sequential and cached I/O speed is comparable to or better than most of the other SSD VPS providers out there.
The HDD VPS is recommended for storage and basic web hosting. The SSD VPS is definitely well-suited for applications that require constant small disk accesses like databases.
Compute test
The vpsbench script has an option for running Unixbench so I went ahead and tested the computational performance.
Here’s the output for the HDD VPS:
   #    #  #    #  #  #    #          #####   ######  #    #   ####   #    #
   #    #  ##   #  #   #  #           #    #  #       ##   #  #    #  #    #
   #    #  # #  #  #    ##            #####   #####   # #  #  #       ######
   #    #  #  # #  #    ##            #    #  #       #  # #  #       #    #
   #    #  #   ##  #   #  #           #    #  #       #   ##  #    #  #    #
    ####   #    #  #  #    #          #####   ######  #    #   ####   #    #

   Version 5.1.3                      Based on the Byte Magazine Unix Benchmark

   Multi-CPU version                  Version 5 revisions by Ian Smith,
                                      Sunnyvale, CA, USA
   January 13, 2011                   johantheghost at yahoo period com


1 x Dhrystone 2 using register variables  1 2 3 4 5 6 7 8 9 10

1 x Double-Precision Whetstone  1 2 3 4 5 6 7 8 9 10

1 x Execl Throughput  1 2 3

1 x File Copy 1024 bufsize 2000 maxblocks  1 2 3

1 x File Copy 256 bufsize 500 maxblocks  1 2 3

1 x File Copy 4096 bufsize 8000 maxblocks  1 2 3

1 x Pipe Throughput  1 2 3 4 5 6 7 8 9 10

1 x Pipe-based Context Switching  1 2 3 4 5 6 7 8 9 10

1 x Process Creation  1 2 3

1 x System Call Overhead  1 2 3 4 5 6 7 8 9 10

1 x Shell Scripts (1 concurrent)  1 2 3

1 x Shell Scripts (8 concurrent)  1 2 3

========================================================================
   BYTE UNIX Benchmarks (Version 5.1.3)

   System: vps16143: GNU/Linux
   OS: GNU/Linux -- 2.6.32-042stab113.11 -- #1 SMP Fri Dec 18 17:32:04 MSK 2015
   Machine: x86_64 (unknown)
   Language: en_US.utf8 (charmap="UTF-8", collate="UTF-8")
   CPU 0: Intel(R) Xeon(R) CPU E31240 @ 3.30GHz (6584.7 bogomips)
          Hyper-Threading, x86-64, MMX, Physical Address Ext, SYSENTER/SYSEXIT, SYSCALL/SYSRET, Intel virtualization
   15:24:41 up  1:06,  1 user,  load average: 0.12, 0.06, 0.01; runlevel 3

------------------------------------------------------------------------
Benchmark Run: Wed May 11 2016 15:24:41 - 15:56:33
1 CPU in system; running 1 parallel copy of tests

Dhrystone 2 using register variables       36593155.3 lps   (10.0 s, 7 samples)
Double-Precision Whetstone                     4423.6 MWIPS (9.8 s, 7 samples)
Execl Throughput                               5297.4 lps   (29.4 s, 2 samples)
File Copy 1024 bufsize 2000 maxblocks        703188.1 KBps  (30.0 s, 2 samples)
File Copy 256 bufsize 500 maxblocks          203782.9 KBps  (30.0 s, 2 samples)
File Copy 4096 bufsize 8000 maxblocks       1824899.9 KBps  (30.0 s, 2 samples)
Pipe Throughput                             1660255.8 lps   (10.0 s, 7 samples)
Pipe-based Context Switching                 287253.6 lps   (10.0 s, 7 samples)
Process Creation                              12821.7 lps   (30.0 s, 2 samples)
Shell Scripts (1 concurrent)                   7966.9 lpm   (60.0 s, 2 samples)
Shell Scripts (8 concurrent)                   1026.0 lpm   (60.1 s, 2 samples)
System Call Overhead                        2384831.0 lps   (10.0 s, 7 samples)

System Benchmarks Index Values               BASELINE       RESULT    INDEX
Dhrystone 2 using register variables         116700.0   36593155.3   3135.7
Double-Precision Whetstone                       55.0       4423.6    804.3
Execl Throughput                                 43.0       5297.4   1232.0
File Copy 1024 bufsize 2000 maxblocks          3960.0     703188.1   1775.7
File Copy 256 bufsize 500 maxblocks            1655.0     203782.9   1231.3
File Copy 4096 bufsize 8000 maxblocks          5800.0    1824899.9   3146.4
Pipe Throughput                               12440.0    1660255.8   1334.6
Pipe-based Context Switching                   4000.0     287253.6    718.1
Process Creation                                126.0      12821.7   1017.6
Shell Scripts (1 concurrent)                     42.4       7966.9   1879.0
Shell Scripts (8 concurrent)                      6.0       1026.0   1710.1
System Call Overhead                          15000.0    2384831.0   1589.9
                                                                   ========
System Benchmarks Index Score                                        1475.5
Here’s the output for the SSD VPS:
   #    #  #    #  #  #    #          #####   ######  #    #   ####   #    #
   #    #  ##   #  #   #  #           #    #  #       ##   #  #    #  #    #
   #    #  # #  #  #    ##            #####   #####   # #  #  #       ######
   #    #  #  # #  #    ##            #    #  #       #  # #  #       #    #
   #    #  #   ##  #   #  #           #    #  #       #   ##  #    #  #    #
    ####   #    #  #  #    #          #####   ######  #    #   ####   #    #

   Version 5.1.3                      Based on the Byte Magazine Unix Benchmark

   Multi-CPU version                  Version 5 revisions by Ian Smith,
                                      Sunnyvale, CA, USA
   January 13, 2011                   johantheghost at yahoo period com


1 x Dhrystone 2 using register variables  1 2 3 4 5 6 7 8 9 10

1 x Double-Precision Whetstone  1 2 3 4 5 6 7 8 9 10

1 x Execl Throughput  1 2 3

1 x File Copy 1024 bufsize 2000 maxblocks  1 2 3

1 x File Copy 256 bufsize 500 maxblocks  1 2 3

1 x File Copy 4096 bufsize 8000 maxblocks  1 2 3

1 x Pipe Throughput  1 2 3 4 5 6 7 8 9 10

1 x Pipe-based Context Switching  1 2 3 4 5 6 7 8 9 10

1 x Process Creation  1 2 3

1 x System Call Overhead  1 2 3 4 5 6 7 8 9 10

1 x Shell Scripts (1 concurrent)  1 2 3

1 x Shell Scripts (8 concurrent)  1 2 3

========================================================================
   BYTE UNIX Benchmarks (Version 5.1.3)

   System: vps16305: GNU/Linux
   OS: GNU/Linux -- 2.6.32-042stab113.11 -- #1 SMP Fri Dec 18 17:32:04 MSK 2015
   Machine: x86_64 (unknown)
   Language: en_US.utf8 (charmap="UTF-8", collate="UTF-8")
   CPU 0: Intel(R) Xeon(R) CPU E31240 @ 3.30GHz (6585.1 bogomips)
          Hyper-Threading, x86-64, MMX, Physical Address Ext, SYSENTER/SYSEXIT, SYSCALL/SYSRET, Intel virtualization
   11:07:31 up 24 min,  1 user,  load average: 0.31, 0.09, 0.03; runlevel 3

------------------------------------------------------------------------
Benchmark Run: Sat May 14 2016 11:07:31 - 11:35:37
1 CPU in system; running 1 parallel copy of tests

Dhrystone 2 using register variables       33907612.7 lps   (10.0 s, 7 samples)
Double-Precision Whetstone                     4381.7 MWIPS (9.8 s, 7 samples)
Execl Throughput                               5071.6 lps   (29.5 s, 2 samples)
File Copy 1024 bufsize 2000 maxblocks        644789.2 KBps  (30.0 s, 2 samples)
File Copy 256 bufsize 500 maxblocks          183641.4 KBps  (30.0 s, 2 samples)
File Copy 4096 bufsize 8000 maxblocks       1728306.8 KBps  (30.0 s, 2 samples)
Pipe Throughput                             1625726.5 lps   (10.0 s, 7 samples)
Pipe-based Context Switching                 270643.9 lps   (10.0 s, 7 samples)
Process Creation                              12870.6 lps   (30.0 s, 2 samples)
Shell Scripts (1 concurrent)                   8398.0 lpm   (60.0 s, 2 samples)
Shell Scripts (8 concurrent)                   1057.7 lpm   (60.0 s, 2 samples)
System Call Overhead                        2322130.4 lps   (10.0 s, 7 samples)

System Benchmarks Index Values               BASELINE       RESULT    INDEX
Dhrystone 2 using register variables         116700.0   33907612.7   2905.5
Double-Precision Whetstone                       55.0       4381.7    796.7
Execl Throughput                                 43.0       5071.6   1179.4
File Copy 1024 bufsize 2000 maxblocks          3960.0     644789.2   1628.3
File Copy 256 bufsize 500 maxblocks            1655.0     183641.4   1109.6
File Copy 4096 bufsize 8000 maxblocks          5800.0    1728306.8   2979.8
Pipe Throughput                               12440.0    1625726.5   1306.9
Pipe-based Context Switching                   4000.0     270643.9    676.6
Process Creation                                126.0      12870.6   1021.5
Shell Scripts (1 concurrent)                     42.4       8398.0   1980.7
Shell Scripts (8 concurrent)                      6.0       1057.7   1762.8
System Call Overhead                          15000.0    2322130.4   1548.1
                                                                   ========
System Benchmarks Index Score                                        1427.8
Both the VPS have similar scores and at 1400+ range, it is as good as a dedicated Atom server. While it isn’t the fastest for the price (according to ServerBear), it packs more value compared to the 4 times more costly BlueHost managed VPS. Also is several times faster than the bigger players like Amazon, Google Cloud, DigitalOcean and Linode. The only big player that comes close to HostSailor in computational performance is Vultr.
Overall, I must comment, for compute-heavy web tasks, this is a bang for the buck. Image processing and video encoding will run absolutely well.
Web hosting test
The above benchmarks will only appeal to those who have a fair knowledge about servers. For the rest of us, it might not make much of a sense. For non-technical folks, it makes better sense to test a real-life application, and what can be better than the classic web-hosting test? Though it might not make you realise what your VPS can do, but it will give you a fair idea if it is fit for your website which is beginning to outgrow shared hosting.
For this test, I installed nginx web server, PHP 7.0 with required modules and MariaDB on the two VPSes. I cloned my personal site (running WordPress) http://sunit.nandifamily.in to the two VPSes on separate URLs and used Pingdom to test the page load time for the two VPSes.
The first thing I did was test the load time for the homepage with page caching turned off.
Here is the page load time from Netherlands.
For HDD:

For SSD:

Here is the page load time from New York City.
For HDD:

For SSD:

Then I tested the blog entries page with caching still turned off.
Here is the page load time from New York City.
For HDD:

For SSD:

The I went to W3 Total Cache and turned on the page cache and other optimizations and did tests again.
Here is the page load time for the homepage from New York City.
For HDD:

For SSD:

Here is the page load time for the blog entries page from New York City.
For HDD:

For SSD:

Here is my original website’s (hosted on x10VPS) page load time test from New York city for comparision. Caching is enabled on the original website.
Homepage:

Blog entry page:

You can see that with optimizations enabled, the sites hosted on either of the HostSailor VPSes is comparable to (or even faster) than the original website. Also, an interesting trend to note here is that the website hosted on the SSD VPS is usually a few hundred milliseconds faster than the on the HDD VPS. The near-zero seek time of an SSD helps in improving webpage load time by a huge extent. The bottom line is that, any VPS you acquire from HostSailor will do absolutely well for web hosting, but I’ll always recommend you to go for the SSD plan.
Customer support
With such low prices for VPS hosting, I was expecting the VPS to be more or less unmanaged and was skeptical about customer support. However, HostSailor mentions they do have managed services and support, so off I went to file a support ticket. I requested an IPv6 address and asked queries on sysctl and what iptables modules are supported.
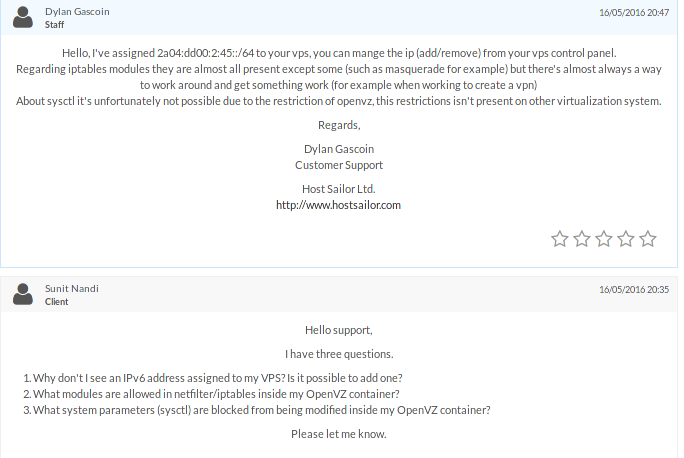
And boy! The support system is really fast. I got an IPv6 subnet assigned and queries answered in just 12 minutes. I can finally add/remove IPv6 addresses from SolusVM.
I must say HostSailor rocks in the support department.
Conclusion
Overall, I’m very impressed with HostSailor’s OpenVZ offerings. Not only the plans are affordable, but also performant in all respects. The network is insanely fast, the I/O is superb for the SSD offering and the computational power is much better than what the big players offer. Both the SSD and HDD offerings worked well in our web hosting test. The only thing I miss are backups addon but it can be purchased from a third-party. The swift customer care response is like a cherry on top.
Rating: 10/10
So, why not give them a try? I’m sure you won’t be disappointed.