The digital age has brought with it a huge amount of new information that has become available and relevant for analysis. But what’s the point if the end-user can’t understand it, structure it, or realize how to benefit from using it? This is the reason why dashboard design is becoming increasingly important.
Dashboard Key Feature & Functions
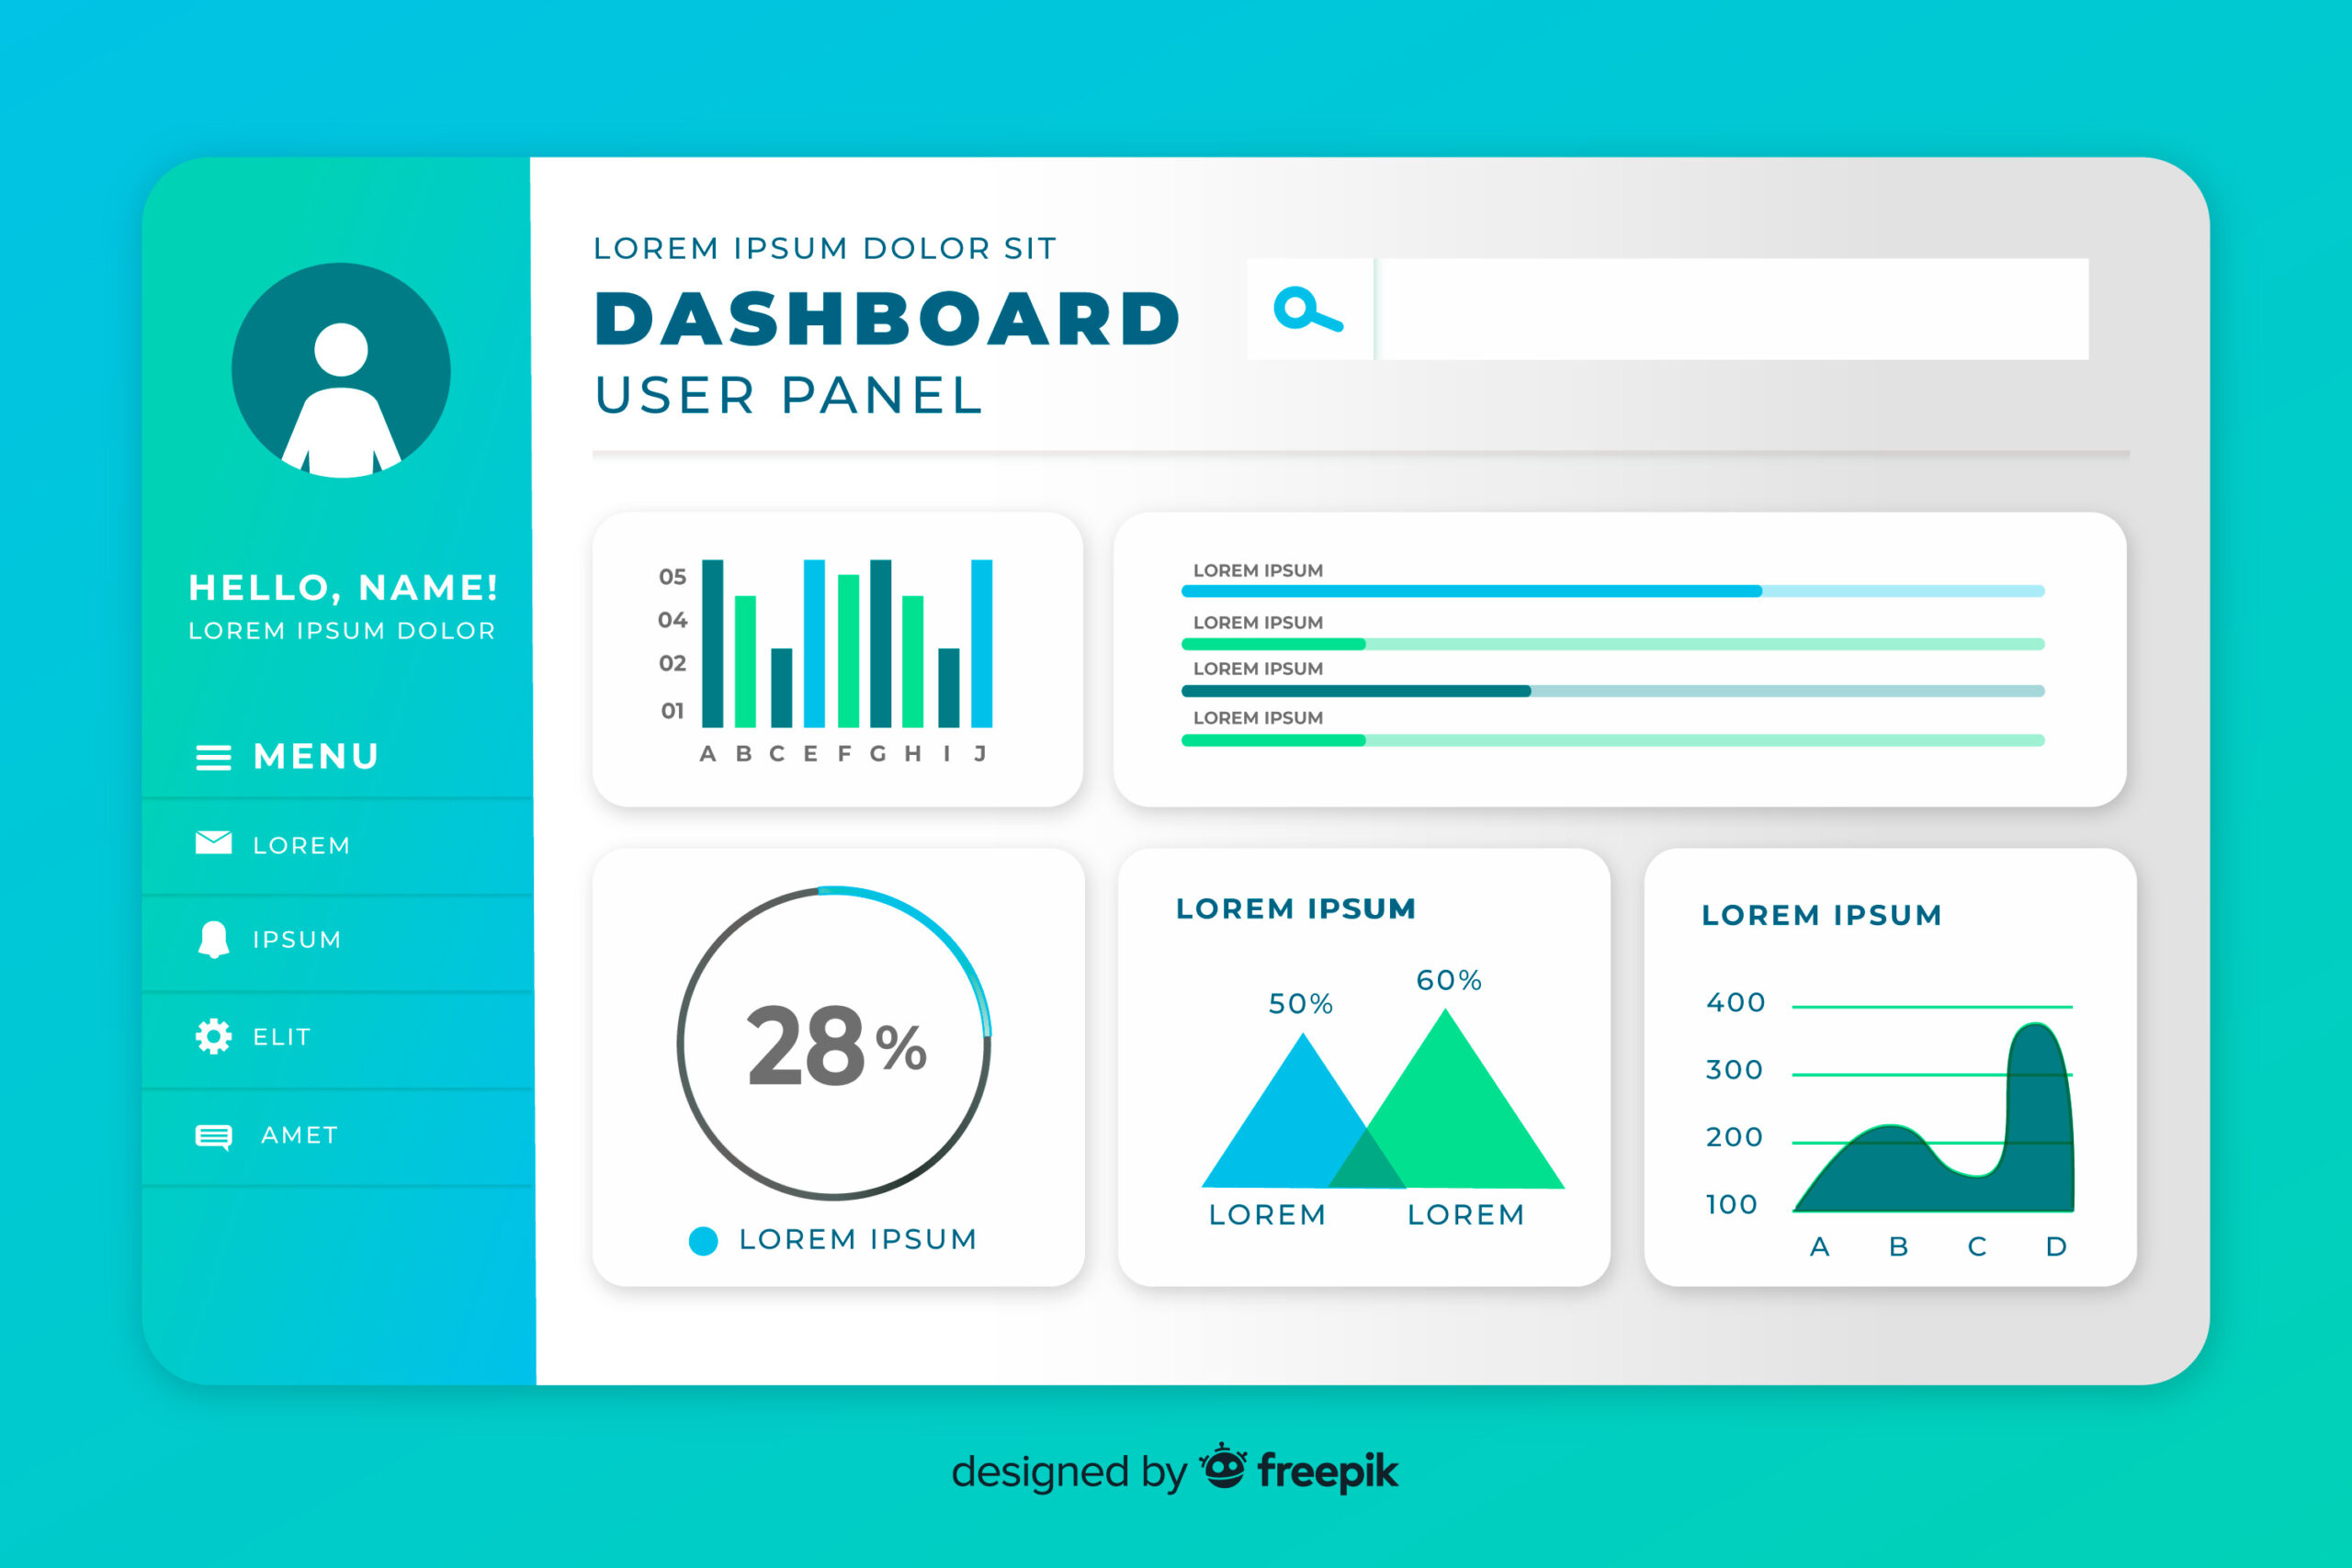
Like any other software, a dashboard performs its tasks, and its main function is to provide information in an easy to interpret way. Based on this, we can highlight the essential features of the dashboard interface, which are as follows:
- Data visualization – you can quickly and easily see interpret any information, be it key site performance metrics, ROI indicators, or PowerBI reports;
- The right context – at a glance, it is clear what the charts are about and what data is presented in the form of graphs;
- The ability to select specific dates/ pieces of info – for example, you can easily change the reporting period in advertising campaigns, filter out some data, or pick a metric that is of interest to you;
- Widget interactivity – data can be filtered according to the selected parameter (for example, by country, city, device, campaign, date, etc.);
- Analytical specs – digital dashboards allow you to compare selected indicators with the previous period in order to evaluate the trend and see the current situation;
- Data tracking potential – with a help of a properly designed digital dashboard, you can track changes with the frequency you need, for example, changes in traffic, conversion, or bounce rates (once a day, a week, etc).
So a good dashboard accurately represents information, whereas a bad dashboard is just a set of data that doesn’t clearly answer your questions.
Image by Freepik
Tips for Creating a Dashboard Interface
There are a couple of recommendations that are important to follow to configure effective digital dashboards. We strongly advise you to adhere to them when resorting to dashboard design services.
Emphasize Information Prioritization
The content hierarchy is the heart of the dashboard. Thinking through the data hierarchy is the most important stage of UX design, but only through visual design, the most important information can be conveyed to users in an accessible form. In a dashboard, it is preferable to use a grid of cards; this allows you to group data and simplifies customization by users. You can also highlight some pieces of information by marking them with a thematic color.
Simplify Customization
When designing a dashboard, it’s essential not to stick to a one-size-fits-all approach. This is justified by the fact that you most likely have several user roles with different needs and priorities. And the information itself must be scalable. It’s important to focus on empowering users with scaling that they can customize to suit their information needs – whether it’s as simple as adding or removing a column or more complex as correlating different data streams.
Ensure Dashboard Simplicity
The real purpose of a digital dashboard is to present complex information in a clear and simple way. Therefore, it is best not to cover too much information on a single sheet; otherwise, it will be difficult for a user to absorb it. You should also use fewer columns to display the data and reduce clutter by removing redundant content.
Use Different Colors
Use an effective color scheme to grab the user’s attention and help them view information easily. Choose colors carefully to make your content readable. Use maximum contrast to correctly display visual elements against the background.
Apply Tags
Use different labels and tags that convey the information the user needs quickly and efficiently. Avoid using rotated labels as they are difficult for a user to read, especially on smaller screens. Give preference to standard abbreviations where possible.
Personalize, Don’t Customize
Users expect the content they see to be tailored to their individual needs. Personalization and customization are techniques to help ensure that users see what is important to them. Personalization is carried out by the system itself. Thus, a dashboard should be configured to identify users and provide them with content and functionality based on their roles. The system may allow users to customize or make changes to the experience to meet specific user needs by customizing the dashboard layout, content, or functionality.
Employ the functionality at Max!
Dashboards are designed to save time and effort by providing a simpler view of complex and abstract data. The purpose of the dashboard is to convey critical information to the audience in a way that they can understand. Be sure to give your audience what they need – design your digital dashboards properly.
Cover Image by Freepik