
When it comes to engaging and informative content, infographics are pretty hard to beat. They are hugely popular, and it’s easy to see why. They look great, and because most people respond better to visuals than text, they are also useful for displaying complex information that would otherwise be too dry and boring. And of course, infographics are perfect for viewing on mobile devices, which are starting to emerge as the primary platform through which audiences consume content.
But, as amazing as they are, infographics are hard to put together, because they require you to have good design skills and extensive knowledge of Photoshop or some other similar tool, which can get pretty expensive. But, even if you are using a free alternative, such as GIMP, designing infographics is still a time-consuming process.
The good news is, you can still create them, even if you aren’t a professional designer or a Photoshop expert, thanks to a variety of different infographics tools and apps out there. With that in mind, we have compiled a list of seven best infographics tools. Keep on reading for more.
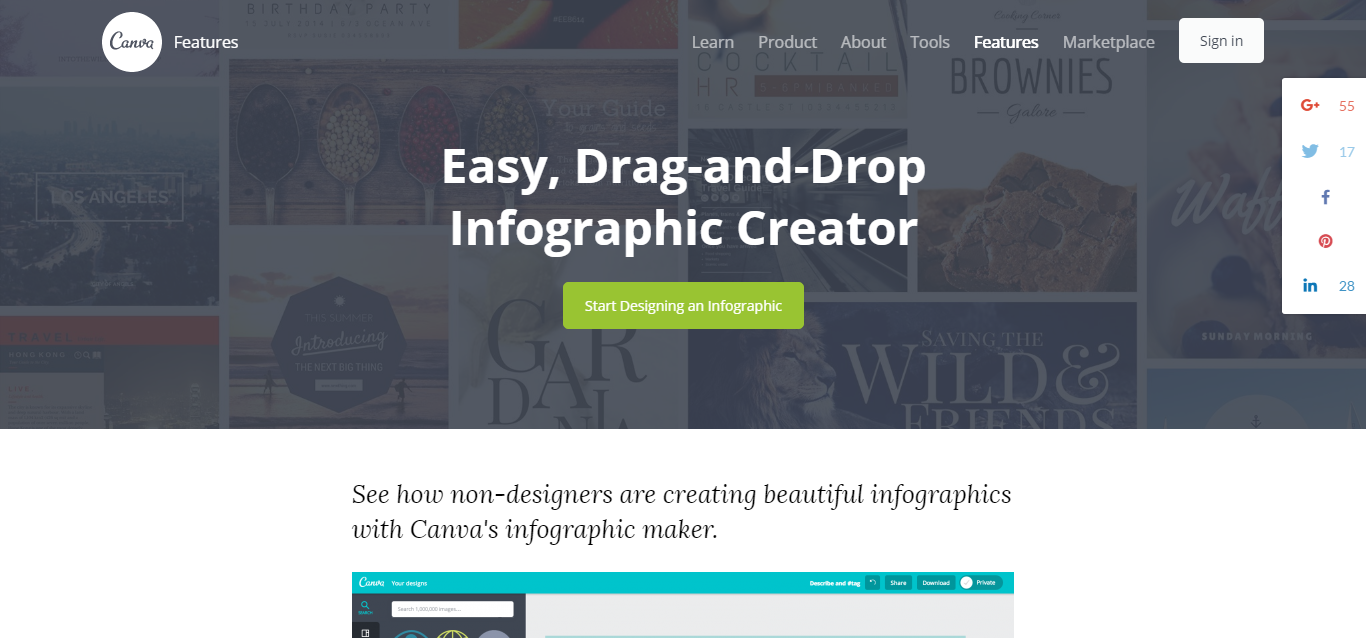
Canva is one of the most popular, and at the same time, one of the most completed tools for creating stunning designs, especially infographics. The app enables you to choose from a huge selection of templates, some of which have been created by other Canva users, and customize each one to your liking and needs. Thanks to its intuitive user interface, drag and drop functionality, and a large number of pre-designed elements, layouts, fonts, and images to choose from, you will be able to create brilliant-looking infographics, even if you are not an experienced designer.
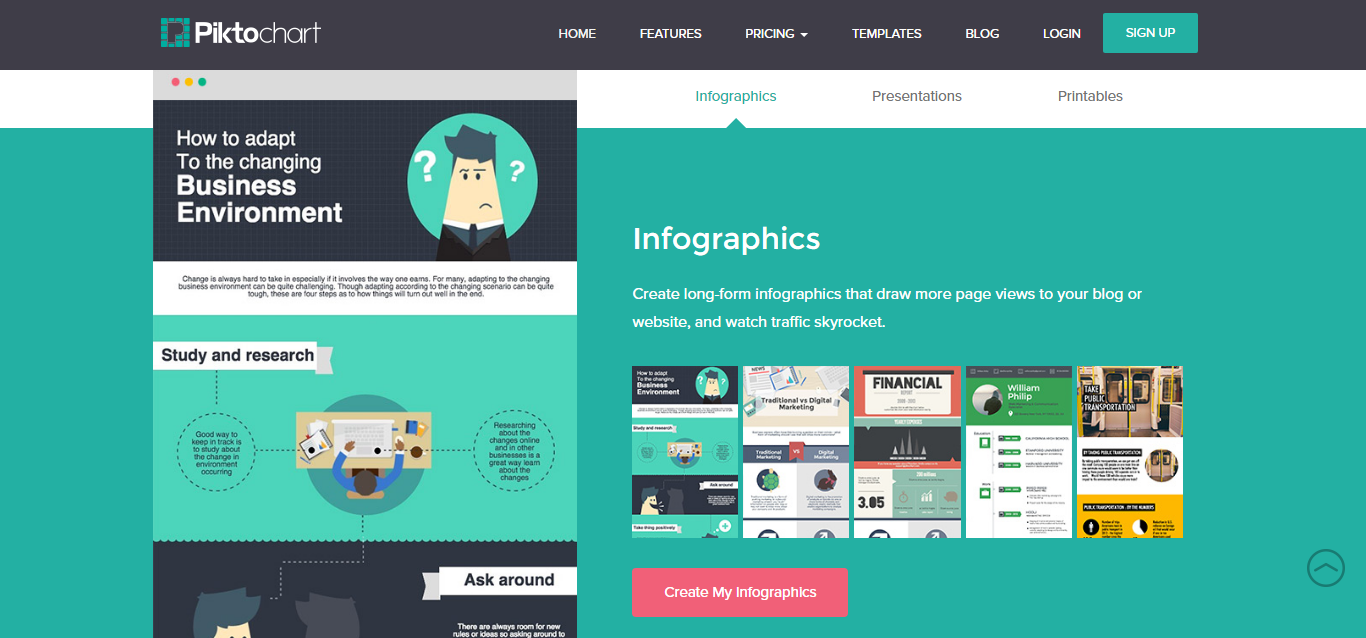
Piktochart is great because it has one of largest selections of infographic templates anywhere, with over 500 designs which were created by professional designers. On top of that, the list is constantly updated with new ones, as well as new design elements, images, videos, and icons. It will save you a ton of time, because you won’t have to look for fresh new material elsewhere. Because the app uses a grid layout, this means you can position and resize all of the elements exactly the way you want.

Easel.ly can be accessed through your browser, which means you can access it from just about any platform. Like its competitors, it comes with dozens of different templates which you can customize and improve. The app also comes with an entire library of design elements, shapes, arrows, connectors, as well as fonts and styles. And if you think that is not enough, you can upload your own designs and combine them with those in Easel.ly to create completely new and unique designs. It’s also very user-friendly, since you can position elements on the infographic with a single touch.
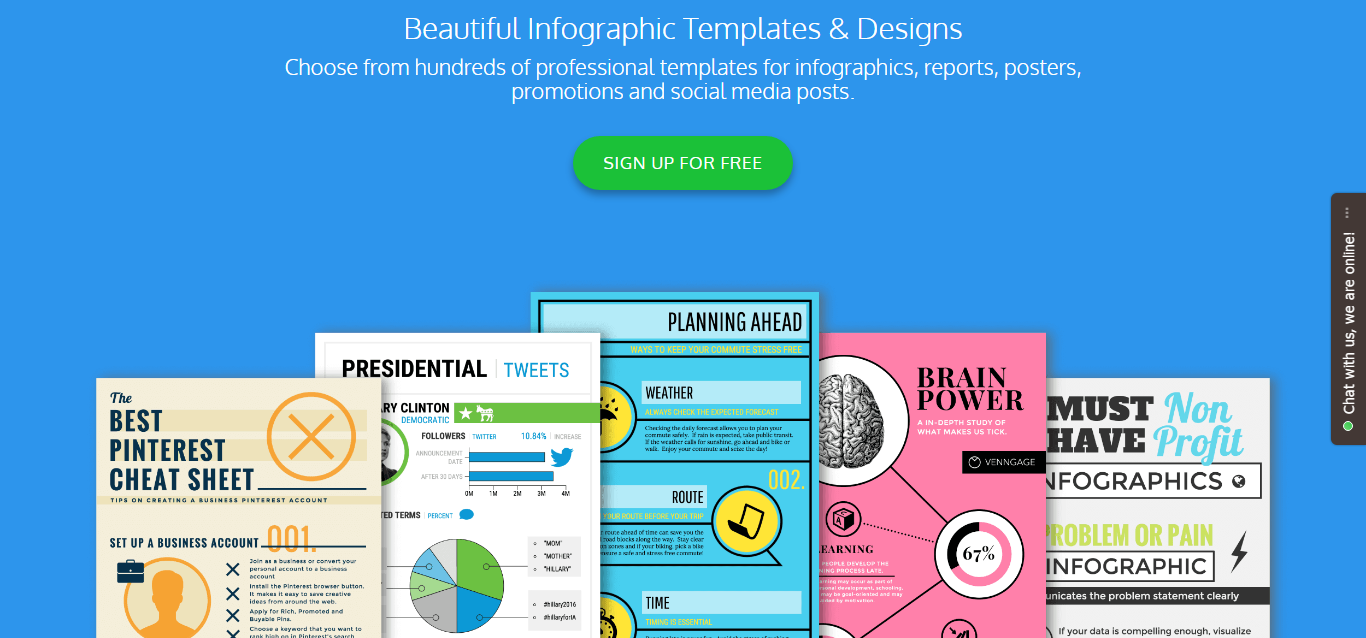
One of Venngage’s strengths is its sole focus on infographics. Such focused approach means you can create an infographic in three steps. This app also comes with a whole bunch of stunning, pre-made templates, and all of the elements from the library are hand-picked to fit in with each other and the template, allowing you to mix and match them until you are happy with your design. If you are an advanced user, or if you prefer to have more control over your designs, Venngage also comes with an advanced editor.

Who says that graphs need to be boring? If you need to present large amounts of data, Infogram is the perfect tool for the job, because it lets you create eye-catching graphs, charts, and maps, to which you can adds images and videos. If you are familiar with Excel spreadsheets, you will find much to like about Inforgram, because it used the same approach to help you create data-centered infographics. Each change in data will affect the graph in real-time, which allows you to view the changes immediately. Also, because their design is responsive, infographics created with Infogram will look great on mobile devices, as well.
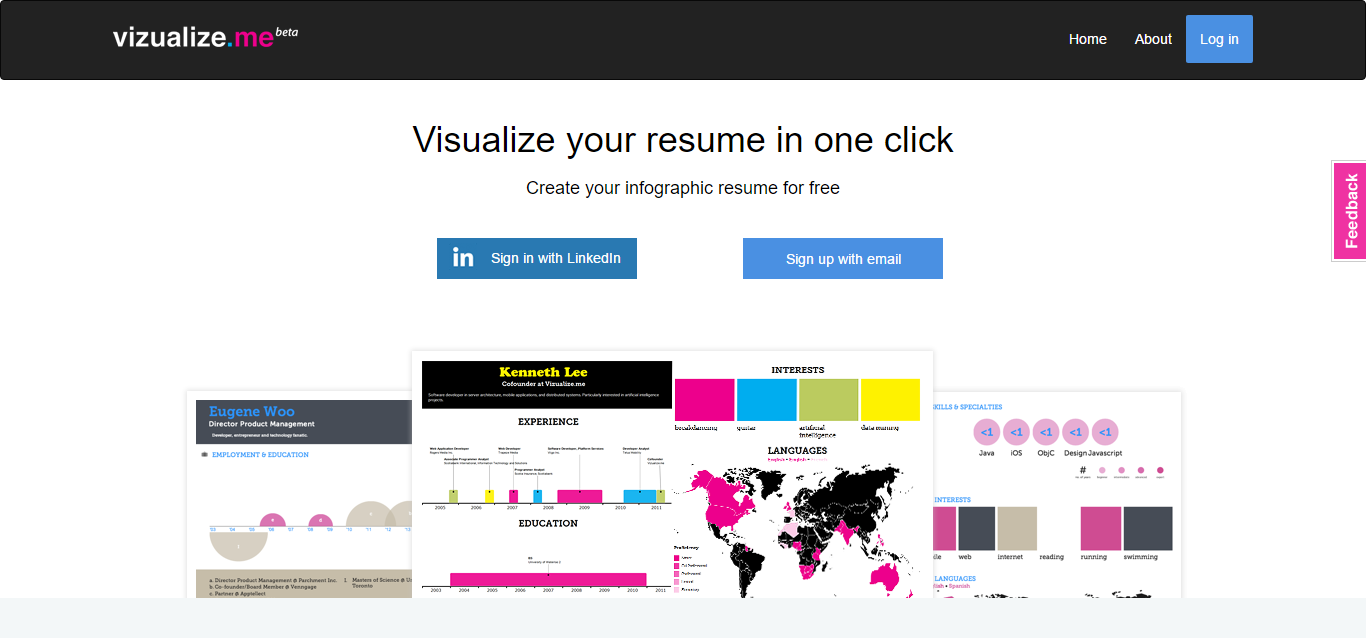
Although you can create conventional infographics with Vizualize, it’s the main purpose is to help you create eye-catching visual resumes. These days, whether you are applying for a job, or reaching out to experts or influencers in your industry, it’s hard to stand out, and having a visual resume will definitely help your cause. The app can automatically create an infographic resume for you based on the information you have entered, or you can choose a template and create your own visual resume.
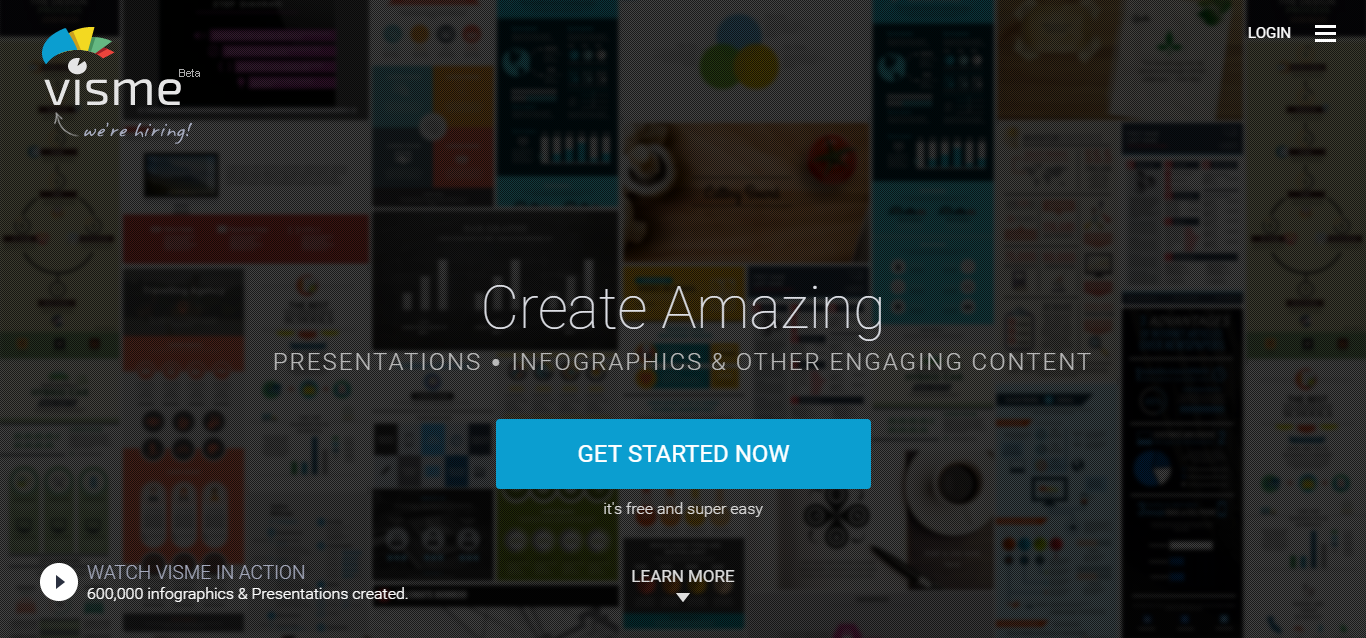
If standard infographics aren’t exciting enough for you and you would like to offer your audience something more, check out Visme. Visme is a tool which allows you to animate your infographics, and which enables you to choose from a whole bunch of built-in animations. Another convenience of this app is that you can put a password on your infographic, so that it can only be viewed by your collaborators before publishing, or premium users on your website or blog.
Conclusion
Infographics are a fantastic way to enhance your content and engage your audience. And now, they are also incredibly easy to make, if you decide to check out one of the tools from the list. Start using them today.
Author’s bio:
Karen Dikson is a marketing expert at EssaysOnTime.com.au. She is an intuitive and creative thinker who is able to connect various thoughts into a single theme. Passionate about traveling and writing. Follow Karen on Twitter.

3 Comments
Sonu
30 December, 2016Thanks a lot for this idea here
jenny
30 December, 2016This is really very fantastic for me ……………….
rahul
30 December, 2016Thanks a lot for allow me comment here . Your blog is really good