Memory leaks in any programming project are dispiriting, to say the least, and so are the restrictions forced upon us when it comes to enhancing the memory. However, there are ways to minimize the memory leaks, and at the same time, boost the memory.
When we are keeping a close eye on the progress of a project, we can often observe that a significant number of extra bytes are consumed during the processes which can be accomplished using lesser volume of bytes. But nevertheless, memory wastage is a common occurrence in programming and it’s something almost unavoidable.
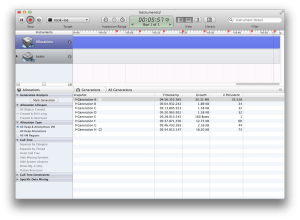
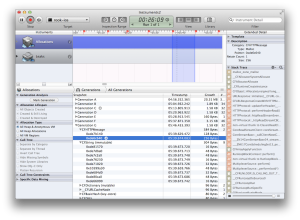
Many programmers, keeping in mind this memory wastage, use the Mark Generation button, a highly resourceful tool that not all programmers are used to implementing. This tool, upon you tapping it, takes some clear snapshots of the objects actively in use and as soon as there is the deallocation of the object, the objects will make their way out of the new snapshots.
Why Take Snapshots?
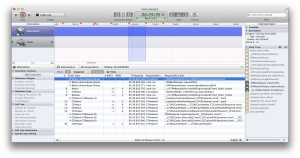
Even if you opt to Hire Android Developers, you must realise the fact that snapshots help us in the generational analysis of the application we are developing and if we are continually involved in taking more and more snapshots, we will get a much better view of the objects being used, allocated and deallocated in real time.
From the snapshots, it is clear that the objects that are currently present in the memory are the part of first generation. As you go on with generation you will get a view of the objects being created, rather than the view of the objects that are being deallocated. The subsequent snapshots are set to show you the ongoing growth, but, at times, the growth also dwindles a bit.
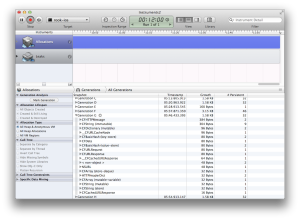
And then, there is a realization that you might actually be creating some kilobytes of data instead of destroying it. And this extra data can really be used for further operation. What you need to do here is to debug the growth. Now, in order to see the objects currently active, you have to tap on the grey right arrow that is visible right next to the generation.
It is clearly visible that there are a lot of objects from the intrinsic foundation. You also get to see a number of NSURL and an ensemble of strings here. And what would surprise you is that whatever you see here, hardly resembles the code that you have been wanting to create.
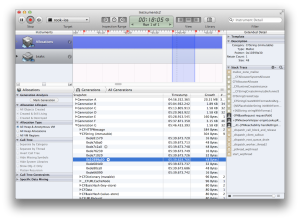
Now, the next step is to find out the active addresses, for which, you need to expand the object types. It would be of great help to you if you instead check out the stack trace for the objects. For that, you will have to fish in to the extended details of the objects.
In there, you might stumble into the stack trace that directs you to the PNReachability. Digging deeper, you get to see retain / release and autoreleases that have been auto performed on this object.
Now, you need to inspect the code for the handleOriginLookupTimer. Here, you will see a synchronous network call being made.
(void)handleOriginLookupTimer {

    // In case if reachability report that connection is available (not on cellular) we should launch additional lookup service which will
    // allow to check network state for sure
#if __IPHONE_OS_VERSION_MIN_REQUIRED
    BOOL shouldSuspectWrongState = self.reachabilityStatus != PNReachabilityStatusReachableViaCellular;
#else
    BOOL shouldSuspectWrongState = YES;
#endif

    // In case if server report that there is connection
    if ([self isServiceAvailableForStatus:self.reachabilityStatus] && shouldSuspectWrongState) {

        __block __pn_desired_weak __typeof(self) weakSelf = self;
        dispatch_async(dispatch_get_global_queue(DISPATCH_QUEUE_PRIORITY_DEFAULT, 0), ^{

            NSError *requestError;
            NSHTTPURLResponse *response;
            NSMutableURLRequest *timeTokenRequest = [[NSMutableURLRequest alloc] initWithURL:[NSURL URLWithString:[PNNetworkHelper originLookupResourcePath]]];
            timeTokenRequest.timeoutInterval = kPNReachabilityOriginLookupTimeout;
            NSData *downloadedTimeTokenData = [NSURLConnection sendSynchronousRequest:timeTokenRequest returningResponse:&response error:&requestError];
//            [[NSURLCache sharedURLCache] removeCachedResponseForRequest:timeTokenRequest];

            dispatch_async(dispatch_get_main_queue(), ^{

                [weakSelf handleOriginLookupCompletionWithData:downloadedTimeTokenData response:response error:requestError];
            });
        });
    }
}
Now, you might be tempted to believe that the bug in the program has something to do with the retain cycles. But that’s not the case. The problem actually lies with the NSURLCache:
diff --git a/iOS/iPadDemoApp/pubnub/libs/PubNub/Network/PNReachability.m b/iOS/iPadDemoApp/pubnub/libs/PubNub/Network/PNReachability.m
index ee4fdcc..bf457d5 100644
--- a/iOS/iPadDemoApp/pubnub/libs/PubNub/Network/PNReachability.m
+++ b/iOS/iPadDemoApp/pubnub/libs/PubNub/Network/PNReachability.m
@@ -476,6 +476,7 @@ void PNReachabilityCallback(SCNetworkReachabilityRef reachability __unused, SCNe
             NSMutableURLRequest *timeTokenRequest = [[NSMutableURLRequest alloc] initWithURL:[NSURL URLWithString:[PNNetworkHelper originLookupResourcePath]]];
             timeTokenRequest.timeoutInterval = kPNReachabilityOriginLookupTimeout;
             NSData *downloadedTimeTokenData = [NSURLConnection sendSynchronousRequest:timeTokenRequest returningResponse:&response error:&requestError];
+            [[NSURLCache sharedURLCache] removeCachedResponseForRequest:timeTokenRequest];

             dispatch_async(dispatch_get_main_queue(), ^{
All you got to do here is to add the removeCachedResponseForRequest, after the sendSynchronousRequest. Once that is done, the large growth of 1.58kb in every 10 seconds can permanently be fixed.
Have you used the Mark Generation tool as yet? Do tell us your experience with generational analysis in the comment section below.
Author Bio:
Juana Steves is a tech savvy content writer associated with Xicom Technologies – reputed Android Development Services. Additionally, feel free to opt or hire skilled Android Apps Developers with her best advices, in case you are looking forward for the same.
